Beyond A1C: New Metrics and Tech-Supported Goals

Dr Utsav Sahu
Dr Utsav is a passionate and hardworking Physician and Diabetologist in Delhi, India. He is an MD (Medicine), MBBS(Gold Medalist) and has a Post Graduate Diploma in Clinical Endocrinology and Diabetes from the Royal College of Physicians, London, UK. He has extensive work experience at AIIMS, St. Stephen's, Hindu Rao and Sant Parmanand Hospital and presently working as a Consultant Physician at Pentamed Hospital. He also practices at Dr Utsav Clinic in Civil Lines, Delhi. He is a diligent and disciplined medical professional with good knowledge of medical diagnostics and he is completely dedicated to patient care.
Read more
Abstract:
Diabetes care is shifting beyond reliance on the A1c test with the advancement in technologies and inventions of the latest biomarkers. The limitations of the HbA1c test in capturing daily fluctuations, and the impact of existing medical conditions have led to the development of TIR, TAR, flash-glucose sensing technology, and 1,5-Anhydroglucitol measurement as modern-day metrics for diabetes care.
Why are doctors moving beyond the A1c test for diabetes Management?
As technology propels healthcare into unprecedented innovations, the diabetes care landscape is evolving rapidly, opening doors to novel approaches and personalised strategies. Earlier physicians perceived the HbA1C test as a cornerstone in diabetes management, providing a crucial snapshot of average blood glucose levels during the previous two to three months. However, its limitations are increasingly evident in capturing the nuances of daily fluctuations and individualised treatment responses. This realisation has sparked a paradigm shift within the medical community, prompting a quest for more comprehensive and precise metrics to drive diabetes care.
In this blog, we explore the emerging metrics and the transformative role of technology in diabetes management. From time in target range to glucose exposure, flash-glucose sensing technology, 1,5-Anhydroglucitol measurement and construction of the Q-Score, we delve into the emerging arsenals for advanced diabetes care.
Limitation of HbA1c in Glucose Monitoring
HbA1c refers to the glycated haemoglobin at the N-terminal valine residue of adult haemoglobin’s β chain. High-performance liquid chromatography and immunoassays are the two most common methods of determining the HbA1c level. However, several factors like iron deficiency anaemia, folate deficiency anaemia, B12 deficiency anaemia, excessive alcohol intake, and asplenia can impact the accuracy and reliability of HbA1c values. These factors increase the erythrocyte life cycle and may result in falsely high HbA1c values.
Similarly, factors like splenomegaly, pregnancy, acute and chronic blood loss, and hemolytic anaemia may shorten erythrocytes’ life cycle and lead to falsely low HbA1c results. Moreover, comorbidities like chronic kidney disease impact HbA1c values especially when the estimated glomerular filtration rate decreases below 30 mL/min per 1.73 m. The above challenges led to the evolution of alternative biomarkers for determining the blood sugar level.
Latest Metrics for Measuring Blood Sugar Values
Physicians are now relying on advanced glucose tests like time in the target range, flash-glucose sensing technology, 1,5-Anhydroglucitol measurement and construction of the Q-Score to navigate the complexities of diabetes management with greater confidence and efficacy.
-
Time in Target Range
Time in target or time in range (TIR) refers to the proportion of time that an individual’s glucose level remains within the optimal target range. The standard time in range for blood sugar is 70–180 mg/dL or 3.9–10.0 mmol/L. Scientists developed the TIR concept when they were looking for a more reliable parameter, “beyond HbA1c” for attaining glycaemic control. The International consensus on TIR proposed that individuals living with type 1 or type 2 diabetes should spend more than 70% (16 h, 48 min) of a day within the TIR, while older and high-risk type 2 patients should spend more than 50% (>12 h) of a day within the TIR.
Fitterfly also undertook a Real-world Effectiveness Evaluation for diabetes management involving 109 participants. This 90-day scientifically approved (DTx) program, where TIR played a crucial role, came out with the following key findings:
- A 1.2% decrease in HbA1C levels among 85% of candidates.
- An average reduction of 2.6% in HbA1C levels for individuals with >9% initial HbA1c levels.
- Time in Range (TIR) improved by 7.1% from a baseline value of 57.5% to 64.6%.
- Time above Range (TAR) decreased by 8.7% from a baseline value of 36.7% to 28.1%.
- Candidates with high engagement with the Fitterfly wellness app showed better results.
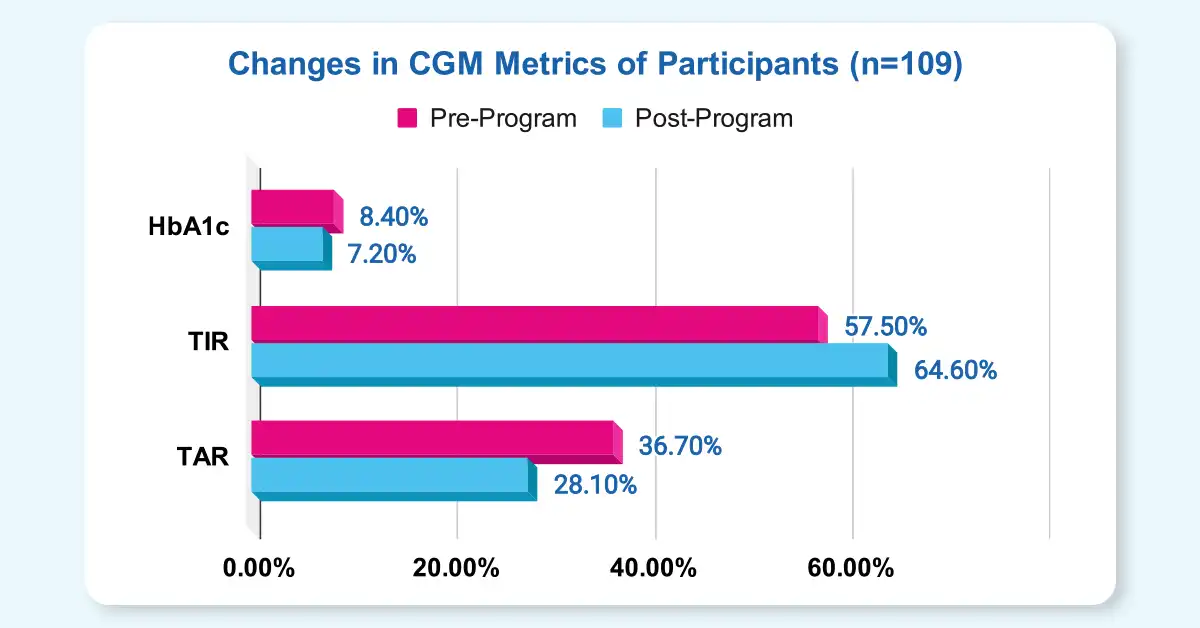
Fig 1: Improvement in HbA1c, TIR and TAR among candidates undergoing the Fitterfly DTX Program.
-
Glucose Exposure
Glucose exposure is the mean or average glucose an individual’s body gets exposed to during a specific time frame. Doctors often monitor glucose exposure overnight, fasting, 2–4 h postprandial to evaluate food, exercise, or insulin’s effect. The average glucose values in every hour divided by the total number of hours give the glucose exposure for the specific time frame.
-
Flash Glucose-Sensing Technology
In the flash continuous glucose monitoring (FCGM) system, patients wear a factory-calibrated sensor on the arm to calculate glucose levels in the interstitial fluid every minute. The device stores the glycaemic value automatically every 15 min, and when patients swipe the reader device over the sensor, they receive both an instantaneous glucose level and the blood sugar trend during the previous 8 hours. The FCCM is a hybrid between meters and CGMs as patients can receive both instant blood sugar readings (like BGM) and trend information (like CGM).
-
1,5-Anhydroglucitol Measurement
1,5-anhydroglucitol (1,5-AG) acts as a biomarker for monitoring acute hyperglycemia. In standard conditions, the 1,5-AG level in blood and tissue remains constant due to renal proximal tubule reabsorption. However, during episodes of hyperglycemia, high glucose prevents renal reabsorption, and thus 1,5-AG get excreted in the urine. At the same time, there is a significant reduction in the serum 1,5-AG level. So, a low serum 1,5-AG level acts as a biomarker for registering postprandial hyperglycemia, which is often a crucial risk factor for the pathogenesis of coronary artery disease (CAD).
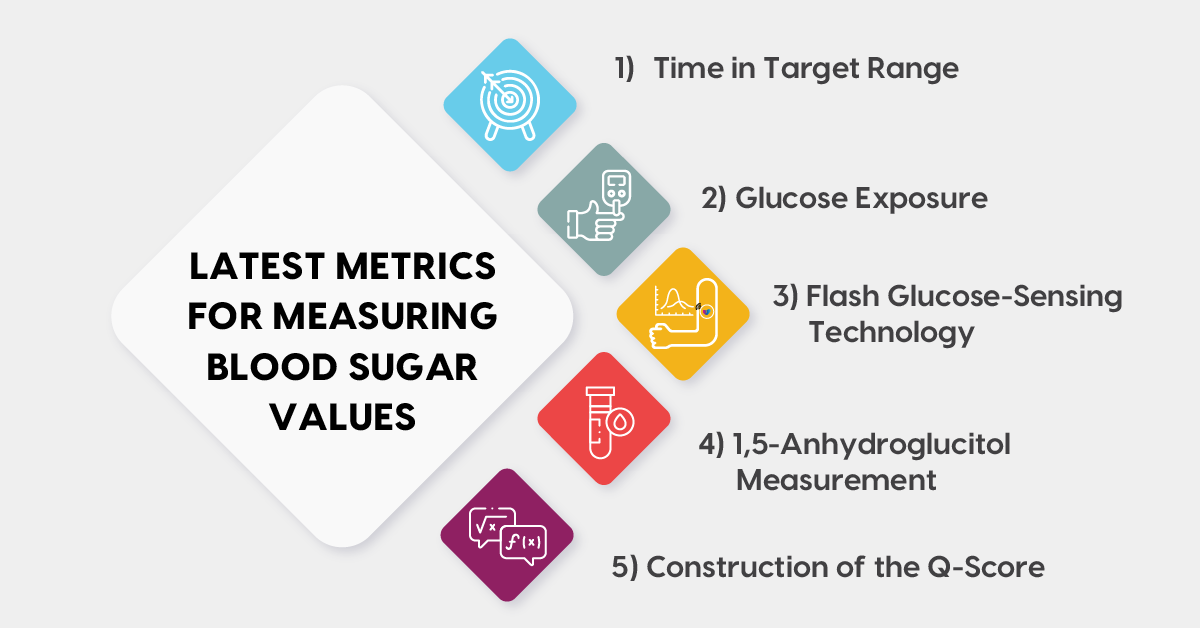
Fig 2: Latest metrics for monitoring glycaemic control
-
Construction of the Q-Score
Researchers have developed Q-Score, which is a new metric for screening CGM profiles of patients, requiring urgent therapeutic actions. Five factors, including central tendency, hypoglycaemia, hyperglycaemia, intra-daily fluctuations and inter-daily fluctuations impact the CGM profile of individuals. Analysts have combined all these factors to compute the Q-Score to identify members showing insufficient metabolic control and devise a patient-tailored approach for diabetes management.
Petra Augstein et al carried out a study involving three diabetologists and 1,562 historic CGM profiles of candidates living with type 1 or type 2 diabetes to compute their Q-Score. The diabetologists classified the profiles into ‘very good’, ‘good’, ‘satisfactory’, ‘fair’, and ‘poor’ metabolic control. The study further revealed that candidates undergoing insulin treatment showed higher percentages of ‘fair’, and ‘poor’ metabolic control than those on nutritional therapy (58.4% vs. 9.3%).
Future Outlook of Modern Metrics for Glycaemic Control
Finally, it would be right to state that though A1C continues to be the gold standard for managing diabetes, in clinical practice, there are several limitations of the HbA1c test. Modern-day diabetologists should prescribe a combination of biomarkers for evaluating glycaemic control and designing the future treatment process.
Key Takeaways:
- Time in target range, glucose exposure, flash-glucose sensing technology, 1,5-Anhydroglucitol measurement and construction of the Q-Score are some of the latest metrics for evaluating glycaemic control.
- Researchers developed advanced technologies for measuring blood sugar as multiple health conditions impacted the HbA1c value.
- Going forward, it would be wise to recommend a combination of HbA1c and other biomarkers to attain greater efficacy in diabetes care.
This blog provides general information for educational and informational purposes only and shouldn't be seen as professional advice.
Want to know how can Fitterfly enhance your practice and improve patient outcomes?